AI releases vs BSV price
Major AI launches on a BSV/USD chart since ChatGPT — then how price moved after each one.
Timing only — not proof that AI news moved BSV.
BSV/USD OpenAI Anthropic Google Other
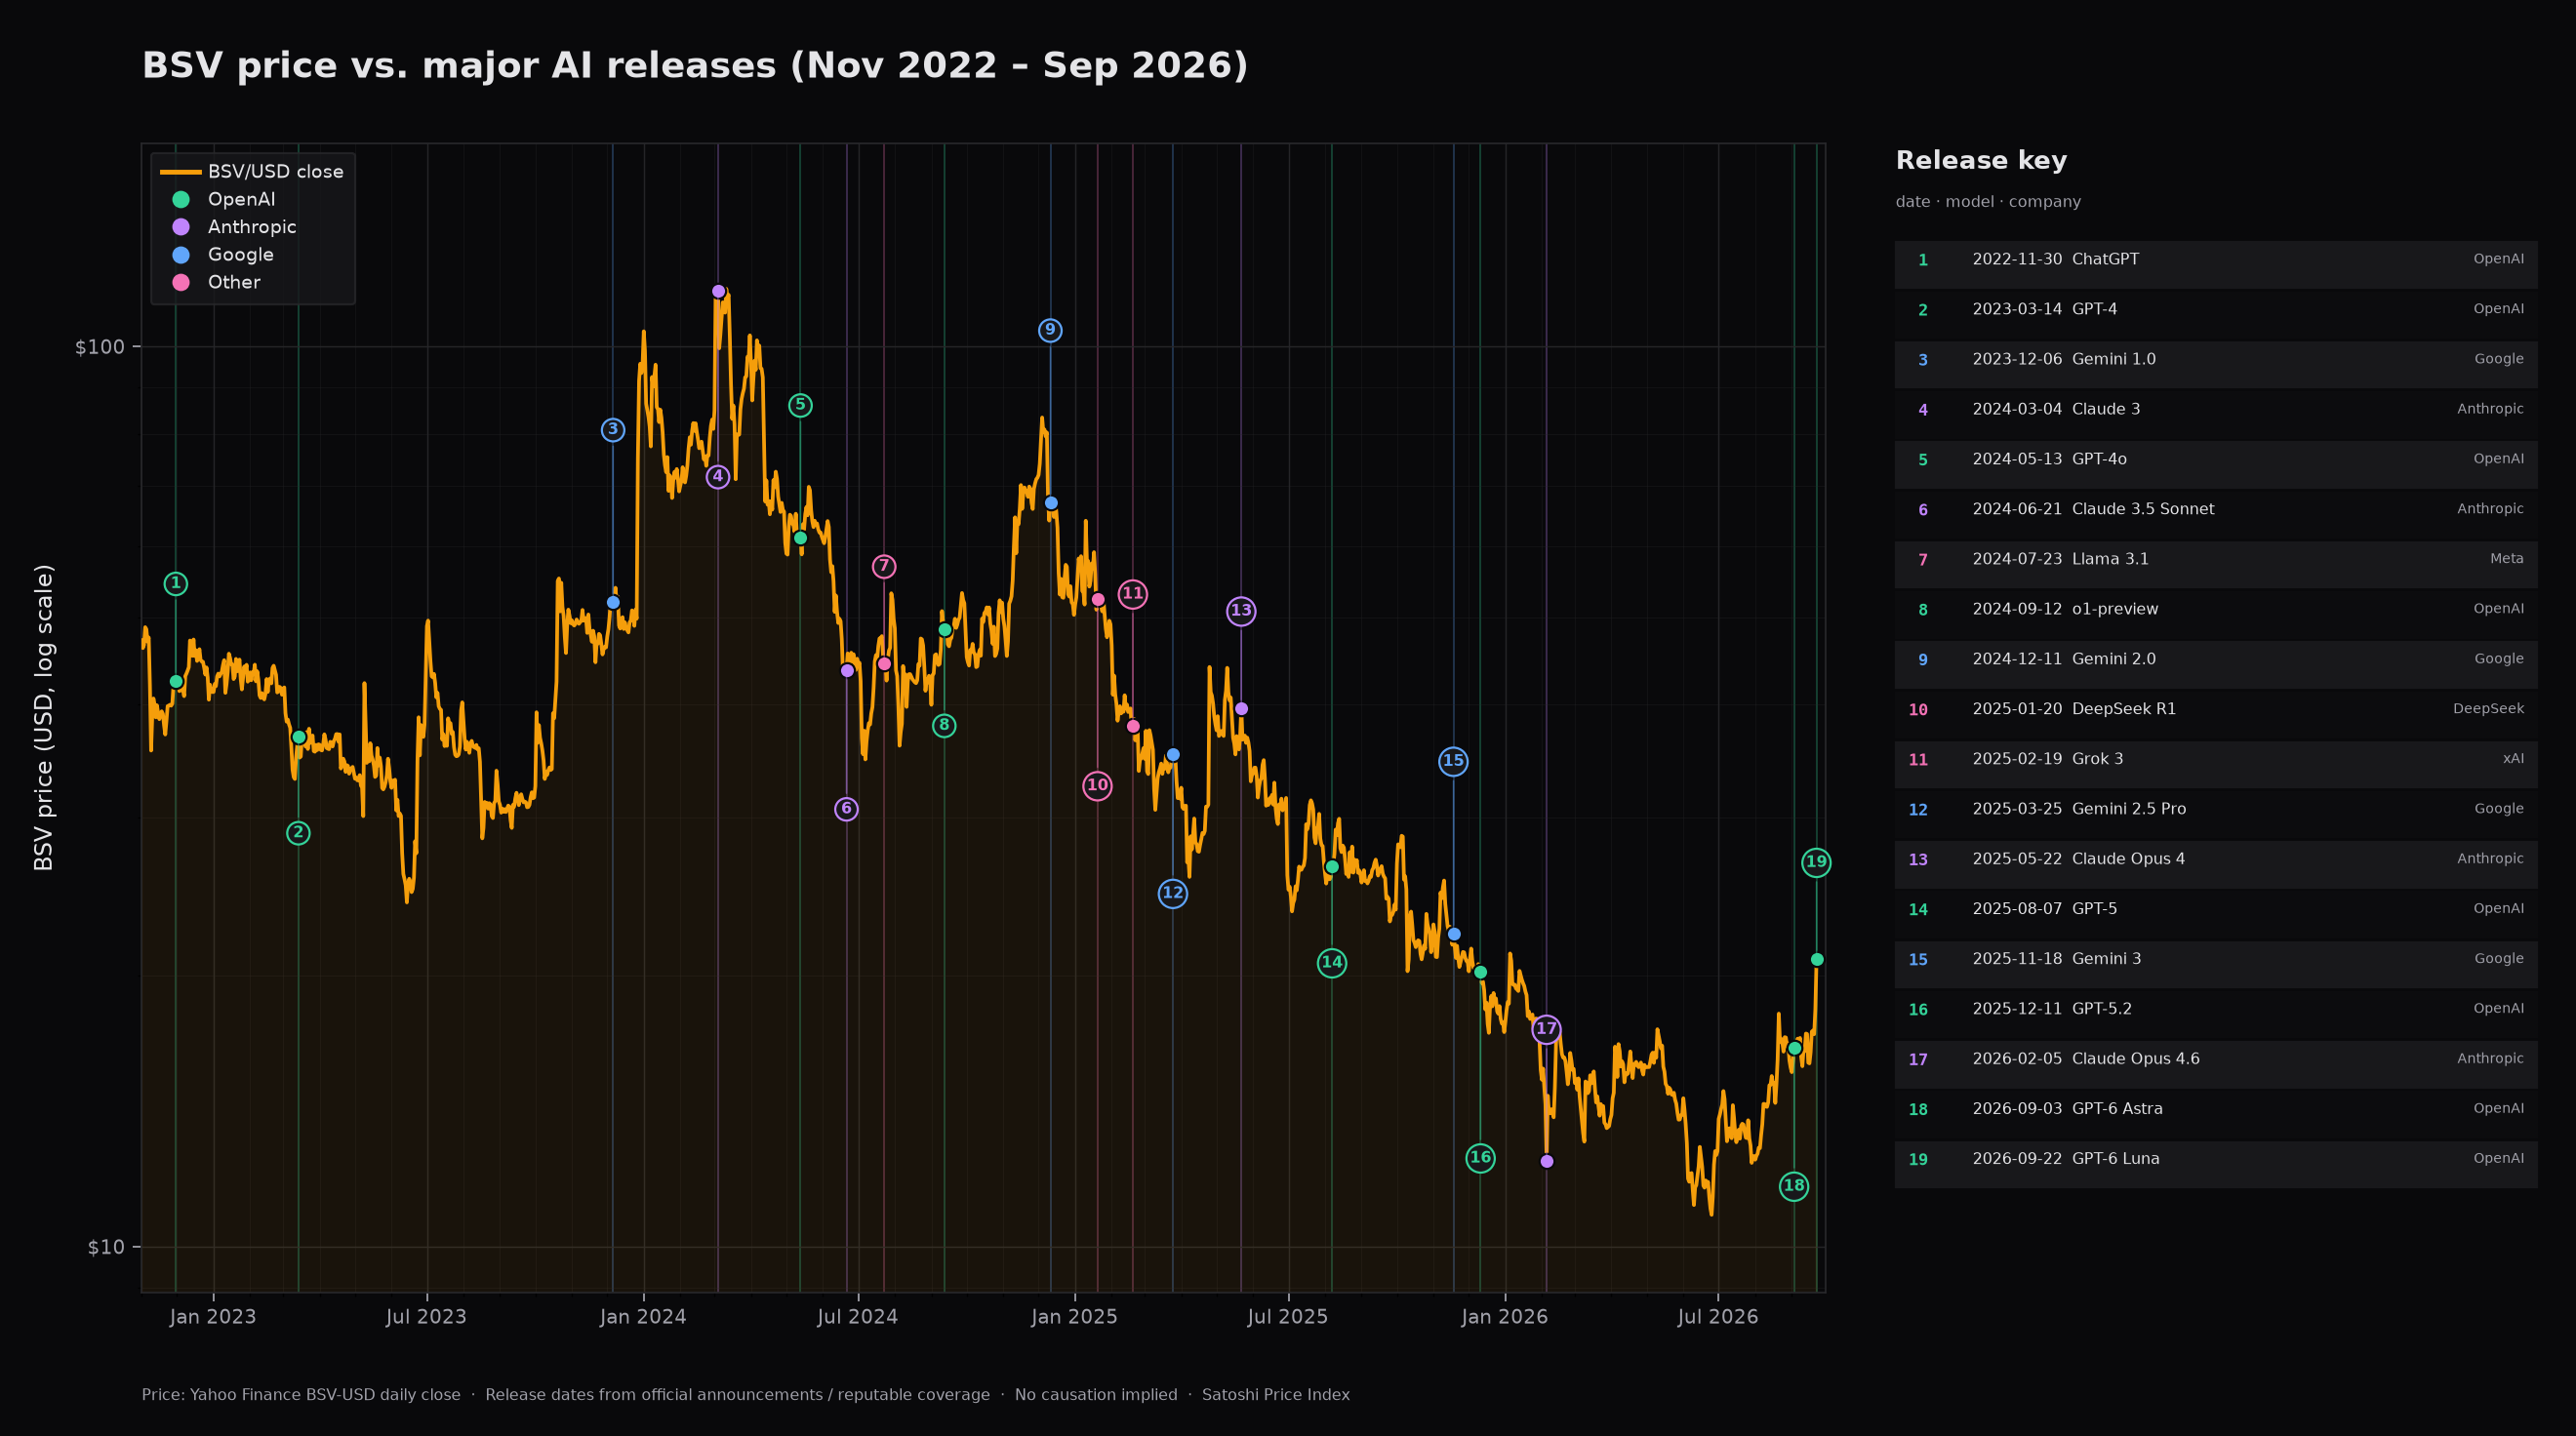
Ranked by move after release
Sort: |24h %| ↓ · Prices as of 2026-09-24
| # | |||||||
|---|---|---|---|---|---|---|---|
| 1 | 2026-02-05 | Claude Opus 4.6 | Anthropic | +18.29% | +20.76% | +10.93% | |
| 2 | 2024-03-04 | Claude 3 | Anthropic | -13.79% | +0.36% | -20.34% | |
| 3 | 2025-05-22 | Claude Opus 4 | Anthropic | -7.76% | -10.41% | -24.68% | |
| 4 | 2026-09-22 | GPT-6 Sol | OpenAI | +5.80% | — | — | |
| 5 | 2026-09-22 | GPT-6 Luna | OpenAI | +5.80% | — | — | |
| 6 | 2023-03-14 | GPT-4 | OpenAI | -5.36% | +1.02% | -1.30% | |
| 7 | 2024-05-13 | GPT-4o | OpenAI | -4.33% | +13.72% | -13.89% | |
| 8 | 2024-06-21 | Claude 3.5 Sonnet | Anthropic | +4.31% | +1.12% | +9.03% | |
| 9 | 2025-11-18 | Gemini 3 | -3.15% | -5.95% | -22.52% | ||
| 10 | 2025-12-11 | GPT-5.2 | OpenAI | -2.86% | -14.51% | -4.23% | |
| 11 | 2025-02-19 | Grok 3 | xAI | +1.83% | -7.99% | -11.17% | |
| 12 | 2025-01-20 | DeepSeek R1 | DeepSeek | +1.20% | -7.25% | -27.68% | |
| 13 | 2022-11-30 | ChatGPT | OpenAI | -1.14% | -3.93% | -2.62% | |
| 14 | 2026-09-03 | GPT-6 Astra | OpenAI | +1.00% | -4.73% | — | |
| 15 | 2024-09-12 | o1-preview | OpenAI | +0.96% | +0.09% | -5.26% | |
| 16 | 2023-12-06 | Gemini 1.0 | -0.72% | -4.55% | +60.33% | ||
| 17 | 2025-03-25 | Gemini 2.5 Pro | +0.48% | -8.16% | -12.06% | ||
| 18 | 2024-07-23 | Llama 3.1 | Meta | -0.38% | +17.65% | -0.64% | |
| 19 | 2025-08-07 | GPT-5 | OpenAI | +0.38% | +4.74% | -4.31% | |
| 20 | 2024-12-11 | Gemini 2.0 | -0.08% | -16.59% | -4.70% |
Frequently asked questions
Do AI releases cause BSV price moves? ▼
No. This page shows timing only — releases next to BSV/USD and short windows after. Correlation is not causation. Use it to explore, not to trade.
Where do the prices and release dates come from? ▼
BSV/USD from Yahoo Finance (BSV-USD). Release dates from each company’s official announcements. Visit Methodology for how SPI handles price data elsewhere on the site.
What time windows do you measure? ▼
For each release we show BSV’s percent change over 24 hours, 1 week, and 1 month after the announcement date. Sort the table to compare.
Is this financial advice? ▼
No. Free educational chart and table. Past moves do not predict future results. Do your own research.
Related pages
Crafted by Ceboruco Studios